
Hi Readers,
In this blog we discuss about how to calculate the beta of any listed company with using of python. how we can do the automate with python code to change the ticker of any company and in one clink we can calculate the regression beta.
As a financial analyst some time we need to calculate the beta to value a company using “Comparable Company Analysis” and at that time we need beta of the company.
but at the time of student of finance we don’t have the access of any database to get real time beta. some where we have option of free website like yahoo finance and others.
Let’s start
First of we need understand that what is beta?
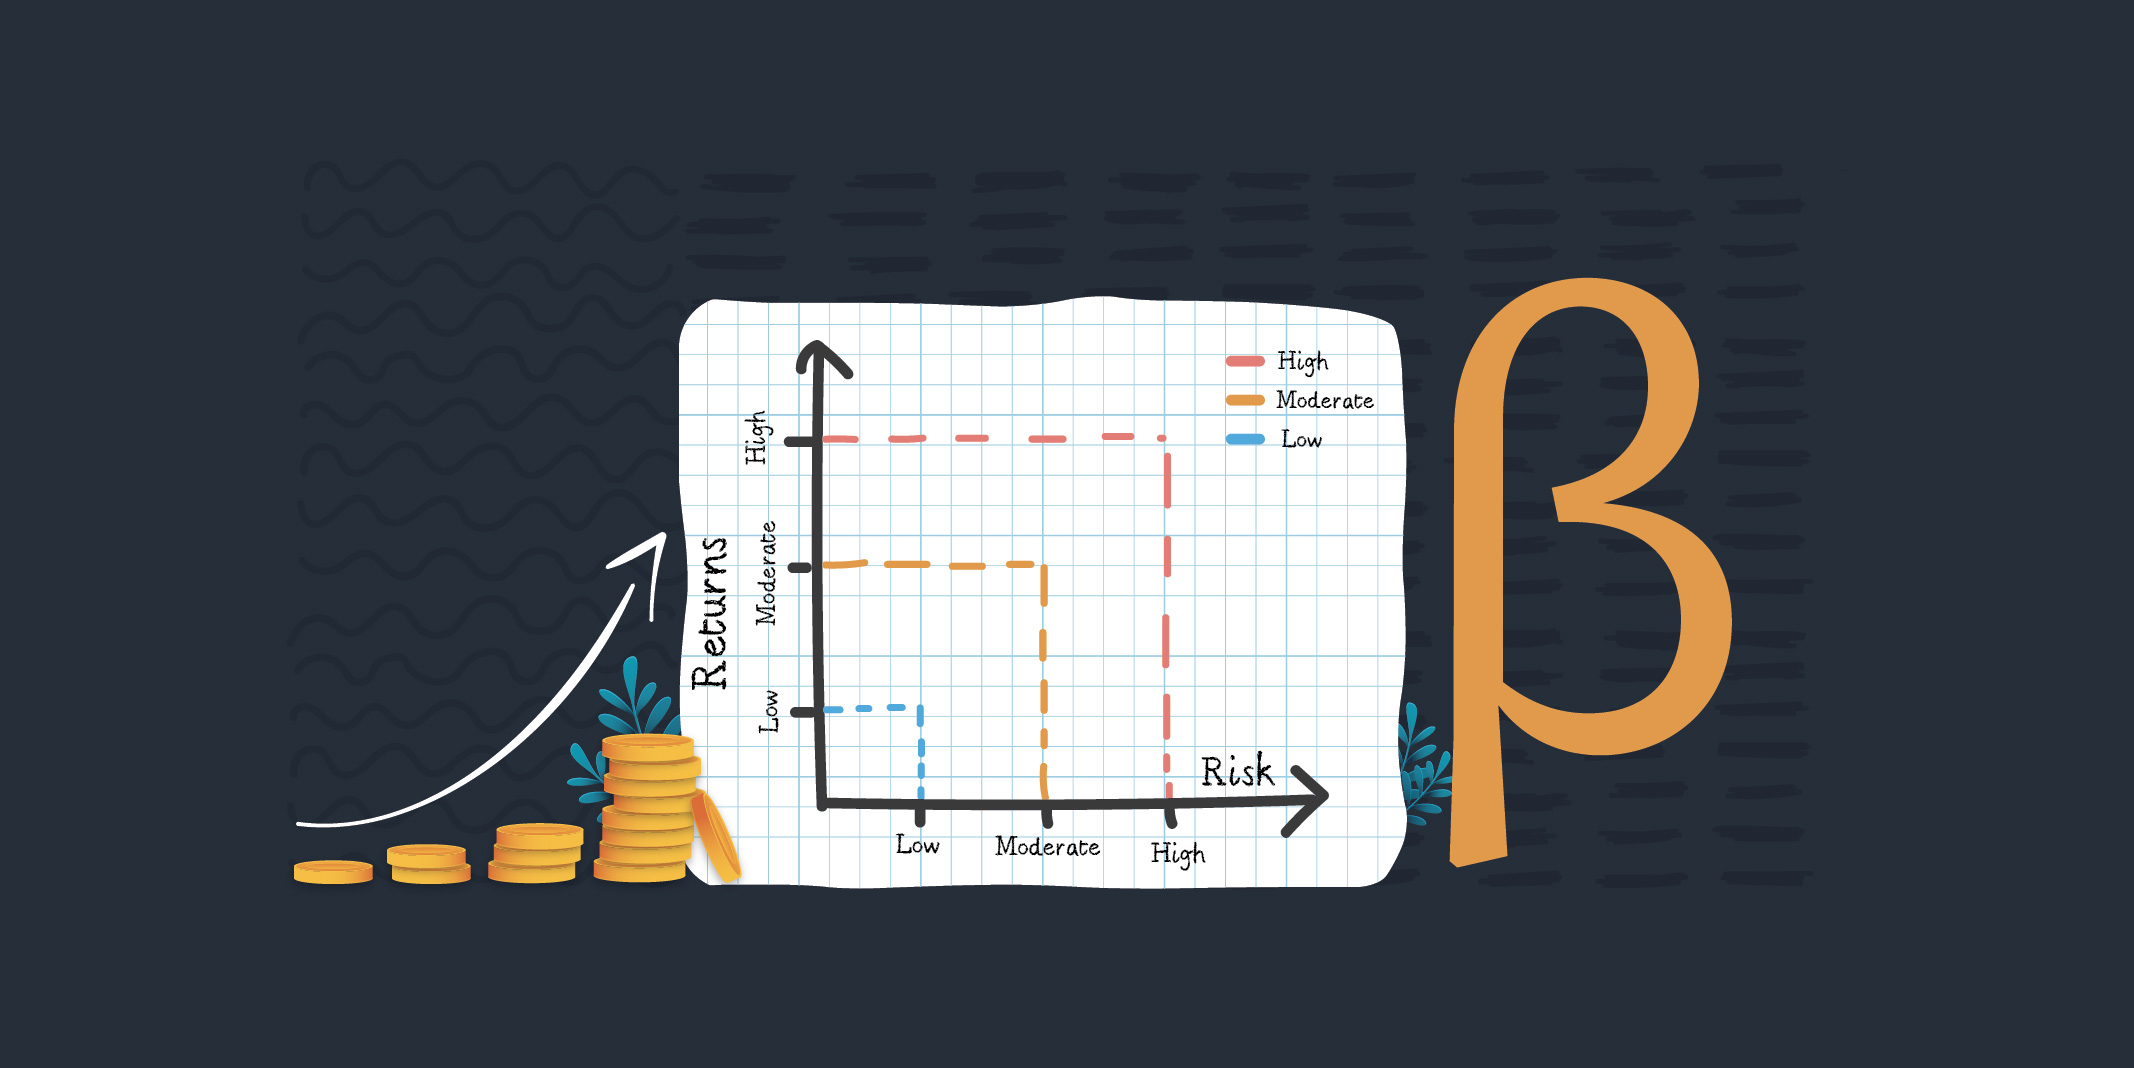
So, the answer is beta is the financial matric to measure the volatility or risk of stock or portfolio in comparison to the overall market (like: Nifty, Sensex, S&P500). It is used extensively in finance to understand how a particular investment is expected to move in relation to the market. Let’s dive deeper into what beta is, how it is calculated, and its significance.
Definition of Beta
Beta is a statistical measure that compares the volatility of an asset or portfolio to the volatility of the overall market. It is a component of the Capital Asset Pricing Model (CAPM), which describes the relationship between systematic risk and expected return for assets, particularly stocks.
Understanding Regression Beta
Definition of Regression Beta
Regression beta, often referred to simply as beta, is a measure of a stock’s volatility relative to the overall market. It quantifies how much a stock’s price moves in relation to a market index, such as the NIFTY 50 in India. A beta of 1 indicates that the stock moves with the market, a beta greater than 1 indicates higher volatility, and a beta less than 1 indicates lower volatility.
Significance in Stock Market Analysis
Beta is a crucial metric for investors and portfolio managers. It helps in assessing the risk associated with a particular stock. A higher beta implies greater risk and potentially higher returns, while a lower beta suggests more stability and potentially lower returns. Understanding beta allows investors to make informed decisions about their portfolios’ risk levels.
Data Collection
Sources of Financial Data
To calculate the regression beta, we need historical stock prices of Varun Beverages Limited and a benchmark index like the NIFTY 50. Reliable sources for this data include financial websites, stock exchanges, and financial data APIs.
Required Data for Beta Calculation
We need daily closing prices for both the stock and the market index over a specific period. Typically, a period of at least one year is used to ensure a robust analysis. The data should include dates and closing prices.
Introduction to Using Python for Data Collection
Python is an excellent tool for financial data analysis due to its powerful libraries and ease of use. We will use Python libraries such as pandas for data manipulation, yfinance for downloading financial data, and statsmodels for performing regression analysis.
Setting Up the Python Environment
Installing Necessary Libraries
Before we begin, we need to install the following Python libraries:
“pip install pandas numpy yfinance matplotlib statsmodels”
- pandas: Used for data manipulation and analysis.
- numpy: Used for numerical operations.
- yfinance: Used to download financial data from Yahoo Finance.
- matplotlib: Used for plotting graphs.
- statsmodels: Used for statistical modeling and regression analysis.
Brief Overview of Each Library’s Role
- pandas: Helps in handling and processing large datasets efficiently.
- numpy: Provides support for large multi-dimensional arrays and matrices.
- yfinance: Simplifies the process of fetching historical market data.
- matplotlib: Allows us to create visualizations to better understand our data.
- statsmodels: Provides classes and functions for the estimation of statistical models.
Collecting Historical Stock Data
Using yfinance to Download Varun Beverages Limited Stock Data
We will use the yfinance library to download the historical stock data for Varun Beverages Limited. Here’s how you can do it:
import yfinance as yf
# Define the ticker symbol for Varun Beverages Limited
ticker = “VBL.NS” # Adjust this based on the stock exchange
# Download historical data for Varun Beverages Limited
vbl_data = yf.download(ticker, start=”2023-01-01″, end=”2024-01-01″)
print(vbl_data.head())
Downloading Market Index Data (e.g., NIFTY 50)
Similarly, we can download the historical data for the NIFTY 50 index:
# Define the ticker symbol for NIFTY 50
index_ticker = “^NSEI”
# Download historical data for NIFTY 50
nifty_data = yf.download(index_ticker, start=”2023-01-01″, end=”2024-01-01″)
print(nifty_data.head())
Data Preparation
Cleaning and Preparing the Data for Analysis
After downloading the data, the next step is to clean and prepare it for analysis. This involves checking for missing values, aligning the dates of the stock and index data, and ensuring that both datasets cover the same period.
# Drop rows with missing values
vbl_data.dropna(inplace=True)
nifty_data.dropna(inplace=True)
# Ensure data alignment
vbl_data = vbl_data.loc[nifty_data.index]
nifty_data = nifty_data.loc[vbl_data.index]
print(vbl_data.head())
print(nifty_data.head())
It’s crucial that the stock and index data are aligned on the same dates to ensure accurate comparison. If there are discrepancies in the dates, it can lead to incorrect beta calculations.
# Align data based on dates
aligned_data = vbl_data[‘Close’].align(nifty_data[‘Close’], join=’inner’)
vbl_close = aligned_data[0]
nifty_close = aligned_data[1]
print(vbl_close.head())
print(nifty_close.head())
Formula for Daily Returns
Daily returns are calculated using the formula:
Daily Return=Current Day’s Close−Previous Day’s ClosePrevious Day’s Close\text{Daily Return} = \frac{\text{Current Day’s Close} – \text{Previous Day’s Close}}{\text{Previous Day’s Close}}
This can be done easily using pandas:
# Calculate daily returns for Varun Beverages Limited
vbl_returns = vbl_close.pct_change().dropna()
# Calculate daily returns for NIFTY 50
nifty_returns = nifty_close.pct_change().dropna()
print(vbl_returns.head())
print(nifty_returns.head())
Applying the Formula to Stock and Index Data
The daily returns for both Varun Beverages Limited and the NIFTY 50 index provide the necessary data points for the regression analysis.
# Create a DataFrame to hold the returns
returns_df = pd.DataFrame({
‘VBL’: vbl_returns,
‘NIFTY’: nifty_returns
}).dropna()
print(returns_df.head())
Performing Linear Regression
Setting Up the Regression Model
With the daily returns calculated, we can set up the regression model to determine the beta. The dependent variable (Y) will be the returns of Varun Beverages Limited, and the independent variable (X) will be the returns of the NIFTY 50 index.
import statsmodels.api as sm
# Add a constant to the independent variable
X = sm.add_constant(returns_df[‘NIFTY’])
Y = returns_df[‘VBL’]
# Perform the regression
model = sm.OLS(Y, X).fit()
print(model.summary())
Running the Regression Analysis Using statsmodels
The statsmodels library provides a comprehensive summary of the regression analysis, including the beta coefficient. The beta value is found in the ‘NIFTY’ row of the summary output.
# Extract the beta coefficient
beta = model.params[‘NIFTY’]
print(f”Beta: {beta}”)
Understanding the Output of the Regression Model
The regression output provides several important statistics, but the key value for our purposes is the beta coefficient. The beta value indicates how much Varun Beverages Limited’s stock returns move in relation to the NIFTY 50 index returns.
Interpreting the Beta Coefficient
If the beta value is greater than 1, it means that Varun Beverages Limited’s stock is more volatile than the market. If it is less than 1, the stock is less volatile than the market. A beta close to 1 indicates that the stock moves in line with the market.
Visualizing the Data
Plotting Stock and Index Returns
Visualizing the stock and index returns can provide additional insights into their relationship. Using matplotlib, we can create a scatter plot of the returns.
import matplotlib.pyplot as plt
plt.figure(figsize=(10, 6))
plt.scatter(returns_df[‘NIFTY’], returns_df[‘VBL’], alpha=0.5)
plt.title(‘Varun Beverages Limited vs. NIFTY 50 Daily Returns’)
plt.xlabel(‘NIFTY 50 Daily Returns’)
plt.ylabel(‘VBL Daily Returns’)
plt.show()
Creating a Regression Plot to Visualize Beta
A regression plot can help visualize the relationship between the stock and market returns, including the line of best fit that represents the beta.
# Plot the regression line
plt.figure(figsize=(10, 6))
plt.scatter(returns_df[‘NIFTY’], returns_df[‘VBL’], alpha=0.5)
plt.plot(returns_df[‘NIFTY’], model.predict(X), color=’red’)
plt.title(‘Varun Beverages Limited vs. NIFTY 50 Daily Returns with Regression Line’)
plt.xlabel(‘NIFTY 50 Daily Returns’)
plt.ylabel(‘VBL Daily Returns’)
plt.show()
Discussing Any Discrepancies
If there are discrepancies between the calculated beta and the published beta, it could be due to differences in the data period, data sources, or calculation methodologies. It’s important to understand these differences and consider them when interpreting the beta value.
Practical Applications of Beta
How Investors Use Beta in Portfolio Management
Investors use beta to assess the risk of individual stocks relative to the market. A high-beta stock is more volatile and may offer higher returns, but it also comes with greater risk. Conversely, a low-beta stock is less volatile and provides more stability. By understanding beta, investors can balance their portfolios to match their risk tolerance.
Real-World Implications for Varun Beverages Limited
For Varun Beverages Limited, knowing its beta can help investors determine how the stock might behave in different market conditions. A high beta would suggest that Varun Beverages Limited’s stock could experience larger price swings, making it a suitable choice for risk-tolerant investors.
Limitations of Beta
Understanding the Limitations and Assumptions in Beta Calculation
Beta is based on historical data, and it assumes that past volatility patterns will continue in the future. This assumption may not always hold true, especially in rapidly changing market conditions or for companies undergoing significant changes.
Situations Where Beta Might Not Be a Reliable Measure
Beta might not be a reliable measure for newly listed companies with limited trading history or for companies in industries undergoing disruptive changes. In such cases, other risk metrics and qualitative analysis may provide better insights.
Conclusion
Recap of the Steps to Calculate Regression Beta
In this article, we have walked through the steps to calculate the regression beta of Varun Beverages Limited using Python. We started with data collection, followed by data preparation, calculating daily returns, performing linear regression, and interpreting the results.
Final Thoughts on the Importance of Understanding Beta
Understanding beta is crucial for investors looking to assess the risk and volatility of their investments. By accurately calculating and interpreting beta, investors can make more informed decisions and better manage their portfolios.
Read the Cost of Equity for where the beta used.
Thank You
Growth Inshots
Discover more from Growth Inshots
Subscribe to get the latest posts sent to your email.